The Data Digest: Introducing the Splinternet Engagement Index
My colleague Josh Bernoff recently published a report called 'The Splinternet Engagement Index." The idea behind this index is that it's getting harder and harder for companies to keep up with the pace of technology developments. Your customers now live in the splinternet — the fragmented world of web, social, video, and mobile touchpoints. Consumers want to reach you across all these touchpoints, but you can't afford to be everywhere.
The Splinternet Engagement Index is a single tool that measures customers' engagement with each of the four touchpoints and identifies how likely a group of customers is to demand connections across multiple touchpoints. First, the index measures consumer engagement with each touchpoint (based on a list of eight activities per touchpoint); it then scores the cross-touchpoint engagement.
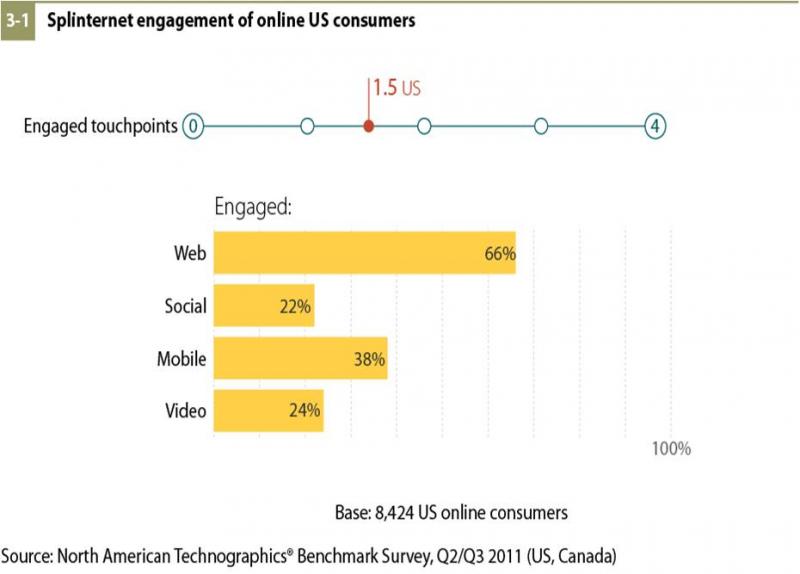
The bars show how much of the population is engaged (i.e., doing at least three of the eight activities identified) with each touchpoint. For example, 66% of the US online population engages with the now mature web touchpoint, while 38% do so with the maturing mobile touchpoint. The scale at the top of the graphic shows the actual Splinternet Index. This is the average number of engaged touchpoints per person, shown as a single number between 0 and 4. You can see that the average number of engaged touchpoints in the US is 1.5, which suggests that most of the general online population is only just becoming active (engaged) across multiple touchpoints.
Why is the Splinternet Index relevant for you? Because it helps you prioritize investments. Simply put, understand where your customers connect, and you'll know where to invest. For example, Gen Yers engage with an average of 2.0 touchpoints, versus an average of 1.8 for their younger Millennial peers, but Millenials are leapfrogging the Web to go straight to mobile. Even if the age difference is only a couple of years, companies need to focus on different touchpoints to reach these two groups.