Data Digest: Social Apps Buzz During Super Bowl 50 Game Day
By: Nicole Dvorak and Kristopher Arcand
On February 7, 2016 112 million viewers tuned in to watch the Denver Broncos beat the Carolina Panthers, the 3rd largest in TV history according to Nielsen data.
To help companies understands consumers’ mobile behaviors on the big day Forrester used its Technographics 360 approach, which combines multiple data sources*.
Our behavioral data indicates that people don’t drastically change their mobile behaviors for the game. However, Twitter’s app attracted a 23% larger audience than the Sunday before. But increased usage isn’t everything: Even though it’s audience size grew by just 1% from the previous weekend, Facebook’s broad reach accounted for 1 in four smartphone owners using the Facebook app during Super Bowl 50 game time hours. Instagram – also popular during Super Bowl game time despite seeing a smaller audience from the previous week – reached 5% of smartphone owners (most of whom were 18 and 24 years old).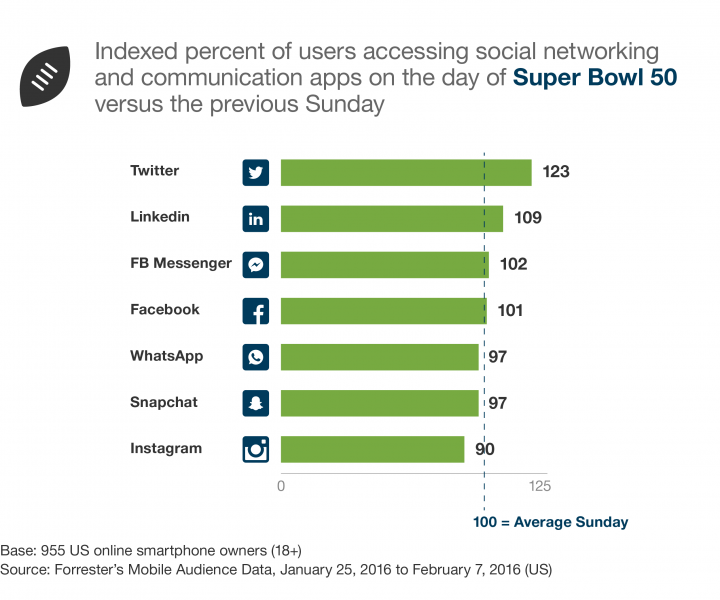
Online consumer conversation revolved around the teams playing, the halftime show, and the ads shown. During the game, they were most likely to access social apps and sites through their readily available mobile devices. In particular, Twitter provided both contests and live commentary for consumers to engage in – though a few also admit to multitasking while watching the game (e.g., checking email, texting friends and family, playing games). Our research shows that Esurance had the most popular ad-related hashtag (followed by Doritos), demonstrating the power of an effective outlet for both ad commentary and sweepstakes entry.
For more information on the smartphone activities of consumers during Super Bowl 2016, please contact your data advisor.
Not a Technographics client and interested in accessing rich behavioral data metrics and insights? Contact us at data@forrester.com.
Nicole Dvorak is a data scientist serving all roles. Follow her on Twitter at @NicoleLDvorak.
Kristopher Arcand is a qualitative data analyst serving all roles. Follow him on Twitter at @kristophersays.
Endnote: We tracked the smartphone behavior of 955 US online smartphone owners (18+) during the two weeks leading up to the Super Bowl, as well as on the day itself. To better understand these mobile behaviors and add further context, Forrester engaged a group of 153 US participants (18+) in our ConsumerVoices online community. Finally, to capture the nature of public conversation overall, we leveraged social listening to explore topics and sentiment throughout the day across US consumers’ social media posts.