Open Data Is Not Just For Governments Anymore…
. . . Nor has it ever really been. Government data has long been a part of strategic business analysis. Census data provides insights into local standards of living and household budgets, health needs, education levels, and other factors that influence buying patterns for all kinds of goods and services. The US Bureau of Labor Statistics and the International Labour Organization provide data on employment and the availability of skilled labor that helps inform decisions on where to locate manufacturing or other facilities. The World Bank and UN data provides insights into global trends.
Moreover, the release of government data has itself spurred billion-dollar industries. Think weather data released in the 1970s by the  National Oceanic and Atmospheric Administration – which gave birth to the weather industry and services like Accuweather, weather.com, wunderground, and newer services like ikitesurf.com’s “wind and where.” Data from the US Global Positioning System (GPS) was opened to civilian and commercial use in the 1980s and has given rise to thousands of location-based services. Think FourSquare, Yelp, and Where’s The Bus?
At the city and local government level, open data complements these existing data sources with data on government assets, operations, and performance. And, at the federal level, the mandate to further open public data through the Health Data Initiative and other federal data initiatives in Energy, Education, and other industries expands available data sources.
What can you do with this data? Innovate. And, if you don’t, your competitors will. New competitors will rise up and disrupt the status quo in all industries. There are already some great examples of companies using government data to complement their internal data for strategy decisions, for product innovation, and for new services themselves.
Healthy example of data innovation
The health industry has feverishly adopted the use of data to enhance existing services and provide new ones.
- Healthgrades.com provides a comprehensive source of information on hospitals and doctors, aggregating data on clinical outcomes, patient safety, and patient satisfaction. Healthgrades aggregates data from a variety of sources, including the Centers for Medicare and Medicaid Services, surveys from HCAHPS (Hospital Consumer Assessment of Healthcare Providers and Systems), Scientific Registry of Transplant Recipients, and data from individual states and other healthcare bodies. Apparently, people spend more time researching purchases of a car or refrigerator than their doctor: 34% of Americans spend less than 1 hour researching a physician.
- 100Plus takes basic health information (weight, height, diet, activities, stress level) and creates a benchmark that is used to compare people to those with similar attributes. Their health predictions are based on large amounts of information culled from sources like the National Institutes of Health and the Centers for Disease Control.
- Healthline provides a health search engine that has ingested massive amounts of data from Health and Human Services (HHS) agencies and other sources to help make Internet searches on health topics and issues substantially more reliable, accurate, and helpful. Healthline registers over 100 million search entries per month, making it the largest health search engine on the Internet.
And, data innovation is not limited to startups:
- Aetna has integrated HHS data on everything from care provider quality to the availability of eldercare support services to the latest medical education information for patients into an “IT cockpit” for nurse case managers in its call centers to help these nurses provide information-rich support for patients. Aetna recently acquired Healthagen, the developer of the mobile app iTriage, a mobile and web platform that allows patients to make better informed health decisions. iTriage has used HHS health facility locator databases to help consumers find nearby care providers. The app has over 3 million downloads on the iTunes store.
Banking on data innovation
The banking industry has equally invested in the data revolution as cited in a recent Wall Street Journal blog:
- JPMorgan Chase generates a vast amount of credit card information and other transactional data about US consumers. Several months ago, it began to combine that database, which includes 1.5 billion pieces of information, with publicly available economic statistics from the US government. Then it used new analytic capabilities to develop proprietary insights into consumer trends and offer those reports to the bank’s clients. The technology allows the bank to break down the consumer market into smaller and more narrowly identified groups of people, perhaps even single individuals. And those new reports can be generated in seconds, instead of weeks or months, JPMorgan Chase CIO Guy Chiarello told CIO Journal.
- Citi, for its part, is experimenting with new ways of offering commercial customers transactional data aggregated from its global customer base, which clients can use to identify new trade patterns. “New silk roads are being created, and we think this information could show signs for which might be the next big cities in emerging markets,” says Don Callahan, who manages internal operations and technology at Citi. According to Mr. Callahan, the bank shared such information with a large Spanish clothing company, which it was able to use to determine where to open a new manufacturing facility and several new stores.
Embracing The Open Data Model
Companies are not just using data themselves, they are inviting others in to see and use their data.
- In 2008, Mint.com launched Mint Data, an initiative that aggregated anonymous spending data from Mint’s users to give real-time insight on what people were spending on across the country. The data was able to identify the most popular restaurants in San Francisco (by visits), the top shopping spots in New York City (by highest average spend), and the highest spending cities in the US. Mint Data also showed spending data both by average purchase price and by popularity, which is defined by number of transactions per month. The rankings could be viewed by category, such as “food and dining,” by specific business, and broken down to the city level. For example, Mint Data showed that the average spend at a Starbucks in New York City is $5.38.
Mint Data was a little ahead of its time. But Intuit has now launched a new data program for developers that provides access to:
o Over 65 million accounts and 11 million users supported today.
o Financial data from over 19,000 financial services organizations across the US and Canada.
o Aggregate consumer and business financial account data, plus auto-categorized transactio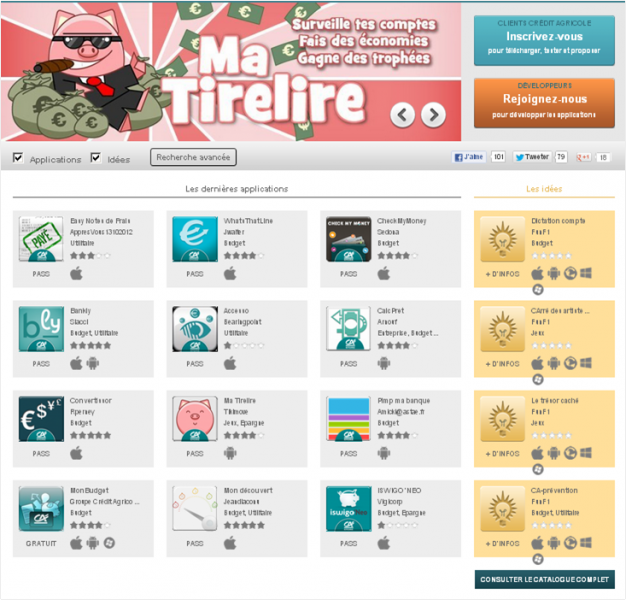 ns.
ns.
o Secure API for cost-effective, self-serve data access.
o SDKs for .NET and Java to accelerate development of your app.
- In another example, Credit Agricole (CA) has launched a developer program with the slogan “applications for you and by you.” The CA Store is a co-creation platform that brings together the bank’s customers – and their application needs – and independent developers and provides the developers with access to anonymised banking data. The CA Store provides an app store making available these new applications and services.
I’ll stop there with my examples. As you can likely tell, I’m excited about the data opportunity. I’ve been a data geek for a long time: Ask me about running policy simulations all night long on housing data in Russia. And now the data revolution and the new “data economy” are really democratizing the use of data and the benefits that it provides.
New research at Forrester on the data economy will provide tools for evaluating data readiness and for developing a comprehensive data strategy.
We'd love to hear your examples of how you are innovating with data – either yours or someone else's.