If A Picture Paints A Thousand Words, Maps Are Just Off The Charts!
 I’ve always been a map person with maps showing up in my house as floor rugs, shower curtains, clothing, dishes, jigsaw puzzles etc. So the ESRI User Conference was right up my alley.
With the explosion of data (and interest in data), organizations are desperate for ways to organize, visualize and better leverage it. Maps are a perfect way to make data real, and the stats on ESRI’s conference show it. The role of “geographical information system” (GIS) professional is thriving. The event organizers registered 14,922 attendees by mid-week, with over 15,000 expected by the end of the week-long event. Attendees represented 126 countries, US representation being largest, but the rest of the top ten including Canada, Japan, Germany, the UK, Austr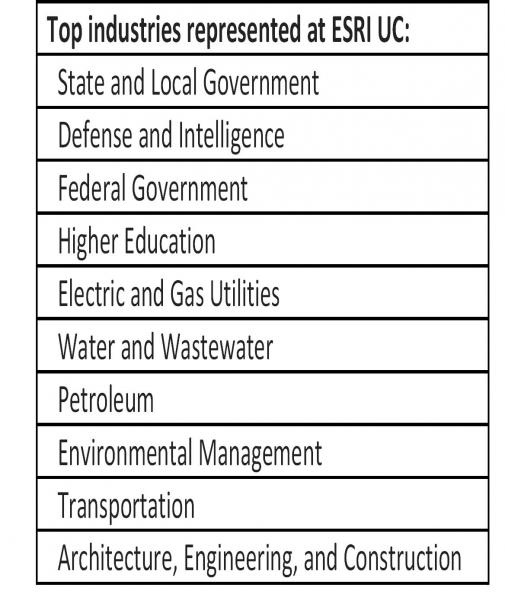 alia, South Korea, Mexico, Norway and South Africa. Of the 36 industries represented, most were public sector including state and local government, defense and intelligence and federal government. But interesting examples were provided across retail – e.g. the use of traffic and demographic data to evaluate and compare alternative retail locations – and other commercial sectors. The list of use cases was impressive – with lofty uses such as planning for the future, preserving resources, and exploration to more down-to-earth examples such as building management, urban planning and law enforcement. In most cases, where there is data, there could be a map to show it, and help understand it better.
ESRI’s main message for the event was “Geography is the platform.” Geography is our platform for understanding the world. And, I’ll admit that, as a map person, I get it. And, so did my kids who I actually took to the event one afternoon to walk through the exhibit floor. They loved the satellite imagery, the terrain maps for fire protection and search and rescue, and the interactive video surveillance maps. My older son has already signed up for an online ArcGIS account. But now I’m getting ahead of myself.
If geography is the platform, ESRI sees itself as the new platform provider, the enabler of the use of geographic information not only by existing GIS professionals but by business users (and students). The tools announced at the event support that role: a new cloud version of ArcGIS Online as “web maps are the new medium for GIS,” new “maps and apps” open source templates to facilitate the development of partner solutions, integration with Microsoft Office, and new support for Mac. Integration with Office means that business users can embed a live, interactive map directly into a presentation, or visualize data on a map directly in spreadsheet. ESRI also stressed its integration of location analytics into enterprise applications such as IBM Cognos, SAP and Salesforce. For example, a public works department can map out work requests in order to deploy work crews more efficiently, or as in the City of Edinburgh, buses can be monitored to record location, minutes behind schedule, and remaining fuel levels.
Many government organizations have already invested in GIS. But the new and really impressive demonstrations were not of GIS professionals mapping data but of how these tools can be used by non-GIS professionals, of how GIS is making the move from IT to BT. A couple of examples stand out:
- Representative Mike Burgess, a Kansas state representative who chairs the Kansas House Government Efficiency Committee and is Vice Chair of the IT Oversight Committee is pushing for greater use of GIS across the state. Among other projects, Rep. Burgess envisions maps created for each piece of legislation to illustrate the geographical impacts across state congressional districts as a way of better informing congressman and their constituents.
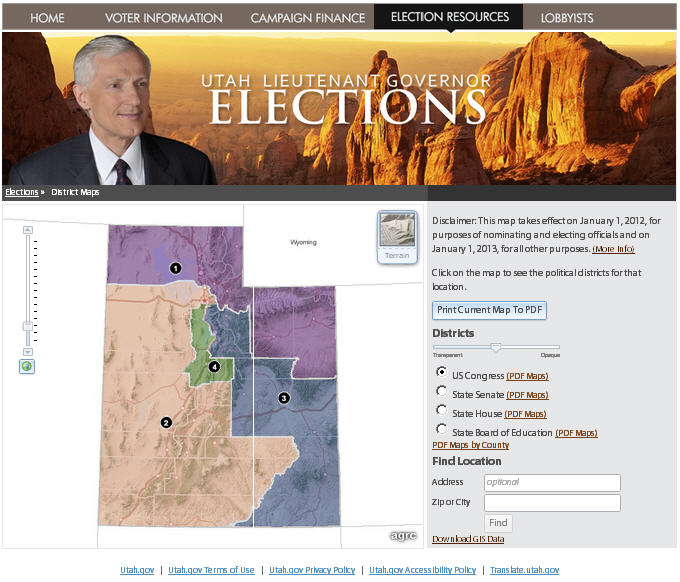
- In Utah, as the state assembly faced yet another potentially explosive redistricting exercise, they decided to bring in the troops – not the National Guard or the State Police but their constituents. They launched an online mapping tool to allow citizens to draw their own maps, within the same ground rules that the Redistricting Committee had to comply with. These maps were then reviewed by the committee and used as a basis for the official exercise. According to ESRI, 400 citizens drew full redistricting maps (not an easy task), and for the first time in 40 years the final maps were not contested.
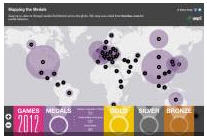 There is more work to be done to spread the word on maps and location analytics. As ESRI points out, GIS is more than dropping a pin on a map. But great progress has been map in getting the story out. And, that story is best told by the maps themselves. Great examples of ESRI story maps can be found at Storytelling with Maps. My kids are going to love the new Mapping the Medals story that was just posted!
As always, I’d love to hear your (map) stories. Thanks.