Forecasting In Uncertainty: Despite The Pandemic, US Tech Jobs Grew In 2020, Led By Data And Security Positions
The US Bureau of Labor Statistics (BLS) released its 2020 occupational employment survey (OES) on March 31. We use this data for our estimates and forecast of US business and government spending on tech staff, utilizing both the data on tech jobs by industry and on average annual salaries for different tech positions. But the OES is also useful for insights on the state of demand for different types of tech-related work, as well as insights on which industries hired or laid off tech workers in the midst of 2020’s pandemic recession. Here are some key takeaways, starting with the occupational data and then shifting to the industry perspective.
US Tech Jobs Grew By 1.2%, With Data Scientists And Information Security Analysts Most In Demand
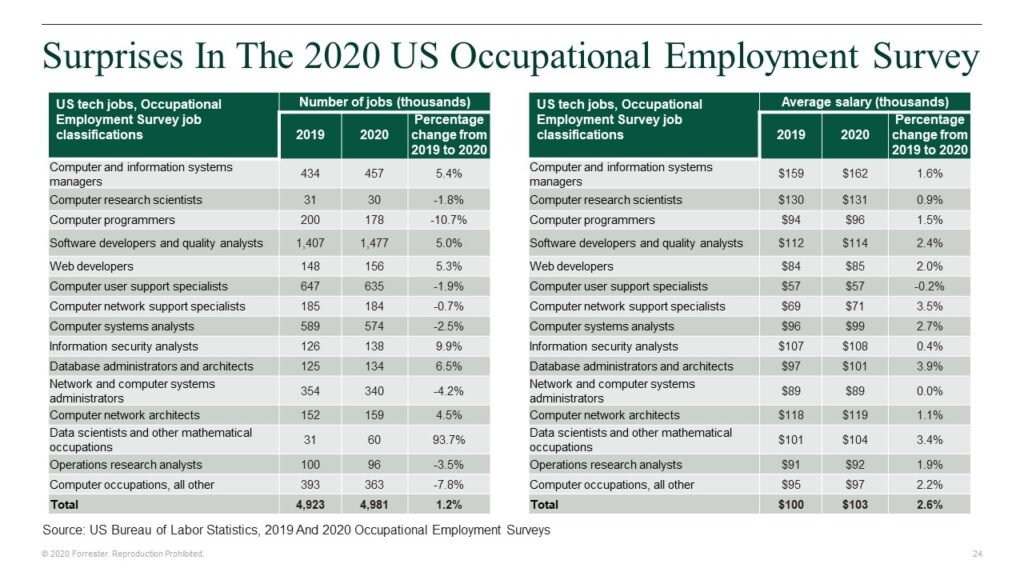
The 2020 OES was conducted in May 2020, near the low point in the pandemic recession. Total US employment in May 2020 was 12% lower (or 17.6 million fewer jobs) than in May 2019. But tech jobs had avoided that fate (see the figure below).
- The total number of US tech jobs in May 2020 was 1.2% higher than in May 2019. Total employment for computer and information system managers and a dozen or so tech-related occupations among both tech vendors and tech users was 4,981,000, an increase of almost 60,000 from 2019 levels.
- The biggest percentage increase was for data scientists, up 94%. Two years ago, the BLS did not break this out as a separate occupation. In 2019, when the BLS first reported data for data scientists, it counted 31,000 workers. In 2020, it found 60,000 workers. This growth is evidence of the rapidly growing interest in and adoption of artificial intelligence algorithms, data sets, platforms, and applications. Additional evidence was the 6.5% growth in the number of database administrators and architects.
- Information security analysts increased by almost 10%. The rapid expansion in support for work-from-home arrangements for employees and remote learning systems for students created the potential for similarly rapid expansion in the points of security exposure. Firms hired 12,000 more security specialists to deal with these security risks.
- There was 5% growth in the numbers of computer managers, software developers, web developers, and computer network architects. Computer managers and computer network architects were in high demand to support new working-and-learning arrangements and the demands that put on networks. But IT departments also faced demands to support new customer sales, marketing, and services channels, which drove demand for software and web developers.
- Computer programmer jobs continued to shrink, down 10.7%. This is a multiyear trend as companies adopt more software-as-a-service applications that have more limited room for customization and as the expansion of no-code/low-code options makes it easier for nonspecialists to create custom apps when needed.
- Network and computer system administrators, operations research analysts, and computer systems analysts experienced reduced demand. The number of jobs here fell by 3% to 4%, as firms pared the staff for running internal systems and supporting major process change initiatives. The number of computer research scientists fell by 2%, while the “Computer occupations, all other” category saw an almost 8% decline. Some of that decrease in “all other,” though, is the reclassification of data scientist jobs into its own new category.
- Reduced workforces did cause small decreases in tech support staff. Given the steep 12% decline in total US employment from 2019 to 2020, the 1% to 2% decrease in the number of computer user and computer network support specialists should be seen as relatively positive news for these positions.
- Average salaries for tech workers generally rose in 2020. The biggest increases were in the data and analytics occupations of database administrators and architects (3.9%) and data scientists (3.4%). But average salaries for computer network support specialists rose at a similar rate of 3.5%. Overall, average salaries for most tech jobs rose by around 2%. The biggest surprise was the 0.4% increase in average salaries for information and security analysts, despite the 10% growth in the number of jobs.
E-Commerce-Related Industries Had The Strongest Growth In Tech Jobs In 2020
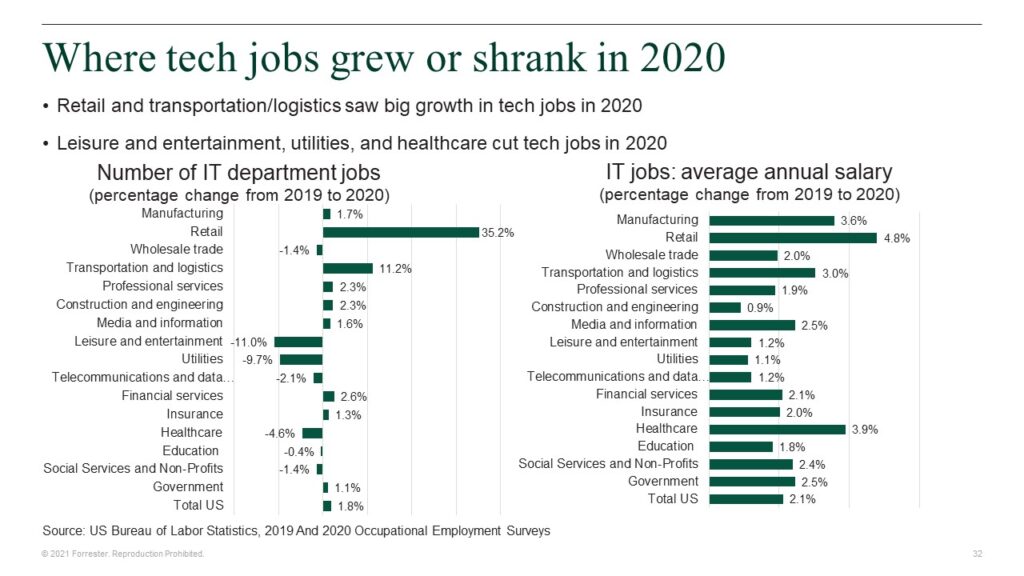
What makes the OES so useful to a tech market forecaster is its data on tech jobs by industry. Sifting through that data and making adjustments to separate out tech jobs involved in product development and support at tech vendors from those in IT departments, we found the following surprises (see next figure):
- Jobs at IT departments in retail jumped by an astounding 35%. This increase was concentrated in the nonstore retailer industry, which saw a 72% increase in tech jobs. The dramatic shift to online shopping caused these retailers to engage in a hiring frenzy to acquire the tech staff needed to support that shift in consumer spending. The number of IT jobs in all other retail segments dropped by 12%: auto dealers (-8%), furniture (-39%), groceries (-2%), building materials (-6%), apparel (-35%), recreation equipment (-30%), and general merchandise (-38%).
- Jobs in transportation and logistics shot up by 11%. Again, two segments of this industry — warehousing/storage and couriers/messengers — accounted for most of the increase in hiring. Companies in truck transportation, water transportation, rail transportation, pipelines, and even air transportation also increased their tech staff, however.
- Services industries expanded tech jobs by 1% to 2%. Professional services, financial services, media and information, and government grew their IT workforce at these modest rates, as did manufacturers.
- Leisure and entertainment, utilities, healthcare, telecom and data, wholesale, and social services and nonprofits cut their tech workforces. The 11.9% drop in tech workers in leisure and entertainment is not surprising given how badly hurt this industry was by the pandemic. More surprising were the 10% drop in IT jobs at utilities and the 5% cut in healthcare IT positions.
- Average IT department tech salaries rose by 2.1% in 2020, with some industries increasing salaries even faster. In terms of tech salaries, a 4.8% increase in the average salary of tech workers in retail is not a surprise (given the industry’s efforts to grow its tech workforces), nor is the 3% rise in tech salaries in transportation and logistics, but a 3.9% jump in the average IT salary in healthcare is surprising given the shrinkage in the IT workforce there. The explanation lies in the healthcare industry’s adoption of AI-based medical diagnosis systems, which caused that industry’s employment of data scientists to quadruple from 2019 to 2020 and thus increased its average salary for tech workers.
Implications For The 2021 US Tech Market Outlook
The OES report is one more sign that the 2020 pandemic recession was much less damaging to the US tech market than we had feared. At the same time, it does limit the growth potential for 2021 — with relatively few layoffs of tech workers in 2020, there is less room for rehiring. The e-commerce-related industries that ramped up hiring in 2020 may now be fully staffed, so our expectation is that tech job growth in 2021 will be moderate, in the 2% to 3% range. Given steady growth in jobs and continued low inflation, we think compensation growth will remain in the same range of 2% to 3%, so our forecast is that total spending on compensation and benefits for tech staff in IT departments will grow by around 5% in 2021.