Forrester’s Annual Benchmark On The State Of US Consumers And Technology In 2017 Is Here!
Forrester’s annual report on the State of Consumers and Technology: Benchmark 2017, US reveals the most important consumer technology trends that marketers need to know. Since 1997, Forrester has surveyed more than three million households worldwide. And during the latter half of that time, we have published an annual benchmark report that reveals the impact of technology on consumers’ attitudes, behaviors, and expectations. This data-rich report is a graphical analysis of a range of topics about consumers and technology and serves as a benchmark for US consumers’ level of technology adoption, usage, and attitudes.
What did we find this year? For mainstream US consumers, smartphone and tablet usage is commonplace: three-quarters use a smartphone and half use a tablet. Users of these devices are no longer early adopters; rather they are typical US consumers.
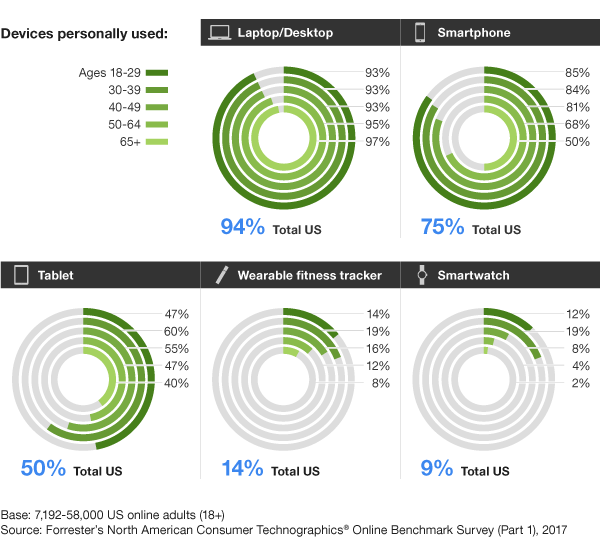
We identify early adopters of new technologies who experiment with and rely on technology. In 2017 this means that 14% of US online adults use a fitness tracker, 8% use a smart speaker with a personal assistant and 7% use Apple Pay. Since age is a strong predictor of technology adoption, this report examines consumers’ technology behaviors through an age cohort lens.
Consumers in their thirties lead in both emerging technology adoption and spending power. Their behaviors demonstrate a deep willingness to experiment across multiple facets of technology—they are the age group most likely to use smartwatch and fitness tracker and to use emerging payment methods. They have the highest income, and they spend an average of $840 online over a three-month period. And it’s not just the Millennials who exhibit extremely connected behaviors. For example, consumers ages 50-64 have now embraced mainstream technology. Five years ago, just over a third of these consumers used a smartphone and 15% used a tablet. Today, over two-thirds use smartphones, just under half use a tablet, and the majority use Facebook and watch online TV.
Our analysis is based on Forrester’s annual online benchmark survey that we run in our North American Consumer Technographics program. The full data set includes almost 2,000 data points and data on more than 150 US brands. It is our biggest consumer survey — in fact, it's the biggest and longest-running survey of consumers and technology in the world — and it covers the impact of technology on a variety of consumer markets, including automotive, consumer technology, banking, healthcare, marketing, media, retail, and travel. For more information, contact data@forrester.com