Developer Landscape 2013: North America And Europe
During the summer, it seems that I spend almost every Saturday mowing the yard. I’m using a self-propelled walk-behind these days, so it takes a good 2 hours to get the whole thing done. The best part is always that feeling when you cut the last swatch of long grass and know it’s time for a nice glass of iced tea or a hefeweizen on the deck. But the good feeling is more than just about being done; it’s as much about completing a good job and being able to look back and survey the results of your labors.
That feeling of satisfaction is the same one I get when a complex and comprehensive research report I’ve written goes web live on our site. In this case, it’s a document that was more than three years in the planning and six months in the execution. If you’re a Forrester client, I hope you’ll find the Developer Landscape 2013 that Vivian Brown and I co-authored illuminating. It’s my first report that extracts some of the more interesting trends we found in our 2013 Forrsights Developer Survey (although James Staten has also tapped the data already here). While I’ve fielded developer surveys before, this one is different — it represents an organic comittment from Forrester Research to a deeper quantitative examination of who developers are; what tools, processes, and technologies they are adopting and using; and what their attitudes and aspirations are. Here’s why you should care:
- Developers are leading indicators of technology shifts. One of the things we’ve been tracking in private surveys and smaller surveys we’ve done is that many developers (~70%) program on their own time. Often, the languages and tools they choose to use on their own time are different than what they use at work. If you know what technologies are growing out in the social coding community and where developers are investing their time, it’s possible to predict what technologies might seep into the enterprise through the back door.
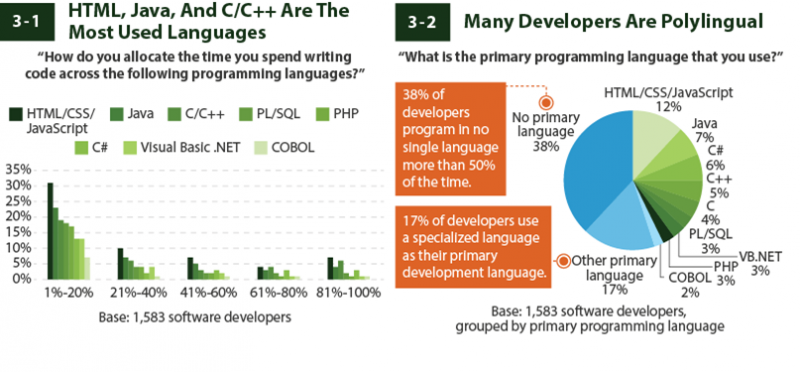
- Differences between new and experienced developers chart shifting skills. I joke with my team members all the time about the differences in my programming habits and those of my 18-year-old son and his peers. If we were the Java versus .NET generation, then they seem to be the “whatever works” generation. The rise of polyglotism (~38% in our survey) represents a move away from developer loyalty to vendors and stacks and languages in favor of a pragmatic approach of using the right tool or framework for the job at hand. It’s also reassuring to see that younger developers (25 and under) show higher adoption rates for development methodoloiges than older developers — maybe we’re on track to a better place from a development process point of view.
- We’re winning some battles and losing others. Some of the results from this year’s Forrsights data are heartening. Developers clearly care about building quality software, they are using testing tools — 28% are using a test-driven development approach — and quality is the top measure of success on development projects. But we’re still not doing very well when it comes to flow and the downstream tasks associated with the regular delivery of code. And developers are spending more time on average dealing with email and attending meetings than they do working with business sponsors, writing test cases, or deploying code. It’s also disconcerting to see the number of developers in large companies who report that they use no formal methodology to guide their actions.
There’s so much good content in our Developer Forrsights data that I’ll be sifting through it for the rest of the year, even while we plan the 2014 survey. We also have data coming in from China and India to compare with our North American and European result set. While we’ve scratched the surface with more than 20 pages of charts and tables, you might want to dig deeper, as there are more than 1 million discrete data points in just the North American and European sample. If that’s the case, you should contact our Forrsights team and they can tell you how you can get access to custom data cuts and even influence future survey questions as a Forrsights client. I expect that I’ll be blogging on some of the more interesting aspects of the 2013 survey for the rest of the year; but in the meantime, I’ll close this post with a sample figure, taken from the programming languages section of the survey:
Categories